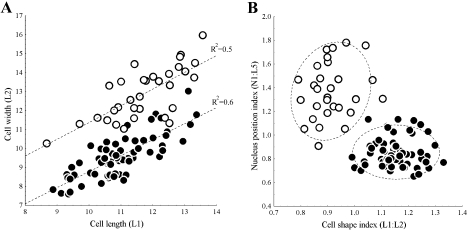
Fig. 5.
Morphometric comparison of the free forms of Ichthyobodo salmonis sp. n. (●) and Ichthyobodo necator (○) from Atlantic salmon (Salmo salar). (A) Scatterplot showing cell width (L2) against cell length (L1). Least squares trend lines and corresponding R2-values indicated. (B) Scatterplots (with 95% range ellipses) show the nucleus position index against the cell shape index. These indices represent the position of the nucleus related to extent of the flagellar pocket (N1:L5) and the length/width relationship (L1:L2); the measures which most clearly separate these species.

