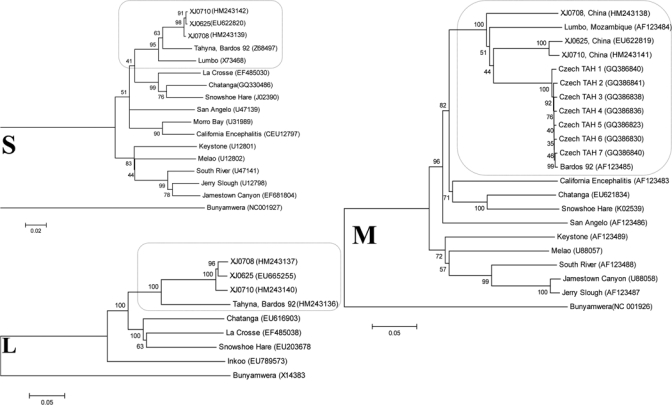
Figure 1.

Phylogenies of California serogroup virus small (S), medium (M), and large (L) segment sequences. Full-length nucleocapsid, polyprotein (Gn and Gc) and polymerase open reading frames of S, M and L segments, respectively, of representative viruses of the California serogroup are compared. Highlighted comparisons of Tahyna virus isolates from China and closely related Lumbo virus isolates appear within selected regions of each tree. Distances and groupings were determined by using the p-distance algorithm and neighbor-joining method with MEGA version 4 software (www.megasoftware.net). Bootstrap values are indicated and correspond to 1,000 replications. Virus names or isolate designations are listed with GenBank accession numbers given in parentheses. The tree was rooted by using Bunyamwera virus as the outgroup virus. Scale bars indicate a genetic distance of 0.05 nucleotide substitutions per position.
