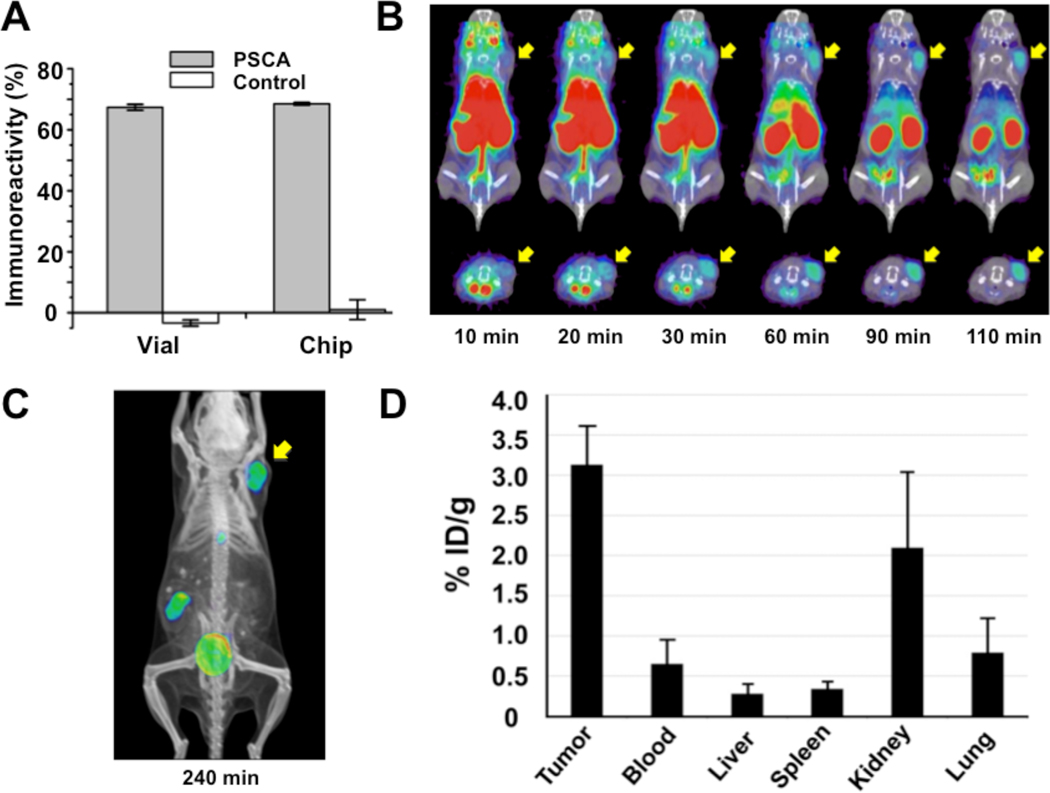
Figure 3.
Biochemical, in vitro and in vivo characterizations of [18F]FB-A2 Db. (A) Immunoreactivity of [18F]FB-A2 Db produced from vial or chip to PSCA-expressing SKW 6.4 and SKW 6.4 cells (control) (n=2). (B) Co-registered microPET/CT dynamic scan images (coronal [top] and transverse [bottom] slices) of nude mice bearing LAPC-9 (PSCA-positive human prostate cancer) xenografts. Tumor locations are indicated by yellow arrows. (C) A co-registered microPET/CT image (coronal projections) 4h p.i. of [18F]FB-A2 Db. (D) Graph of biodistribution study of [18F]FB-A2 Db (4 h p.i.) (n=3).

