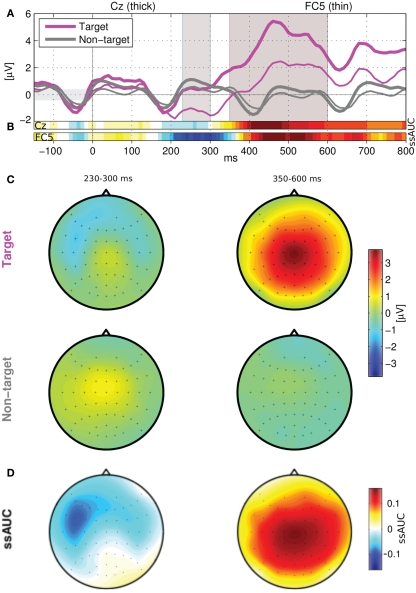
Figure 4.
(A) Grand averaged ERPs at electrodes Cz (thick lines) and FC5 (thin lines). The ssAUC bars (B) quantify the discriminative information for the two channels. The averaged ERP scalp maps of target and non-target stimuli for the two marked time frames are shown in (C) and the class discriminability (ssAUC values) is depicted in (D). The scales for (B) and (D) are equal.

