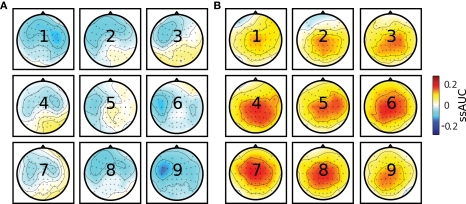
Figure 5.
Grand average of the spatial distribution of the stimulus-specific N200 component (A) and P300 component (B). Area-under-the ROC-curve (ssAUC) values are signed such that positive values stand for a positive components and negative values represent negative components. Plots are arranged corresponding to the 3 × 3 design of the PASS2D paradigm.

