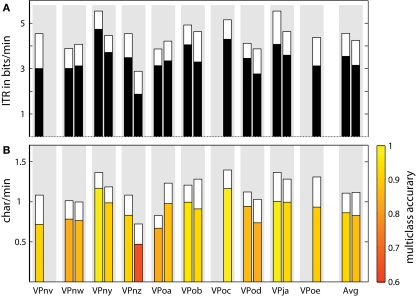
Figure 7.
For each subject and both sentences the bar plots show the multiclass accuracy and the resulting Information Transfer Rate (A) and the spelling speed in characters per minute (B). The white extensions of the bars mark the potential increase, that could result if individual pauses are disregarded for the computation of the spelling speed and ITR. For each subject, the left (right) bar represents the performance of the short (long) sentence. For three subjects there is only one bar, because the spelling of the second sentence was canceled or not even started.

