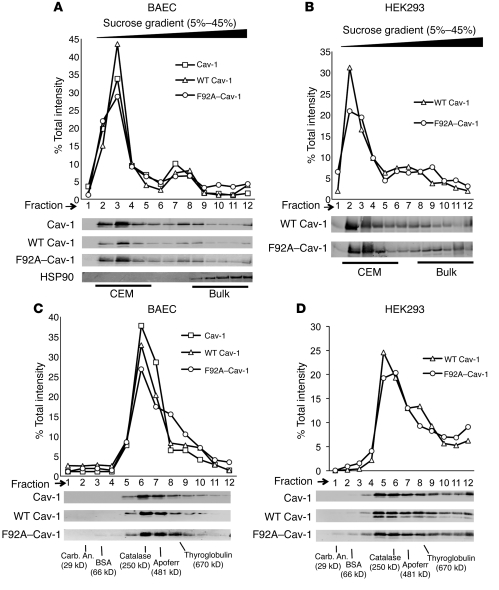
Figure 2. F92A and WT Cav-1 show similar biochemical properties.
(A) BAECs were infected with adenoviruses (25 MOI) encoding for WT (myc tagged) and F92A–Cav-1 (HA tagged) for 48 hours and lysates subjected to sucrose gradient fractionation. Top panel depicts relative distribution of proteins across the gradient (quantified by densitometry), and bottom panels show levels of endogenous Cav-1 (top), WT Cav-1 (myc), F92A–Cav-1 (HA), and HSP90 as a control Immunoblot analysis from fractions collected. Fractions 2 to 5 represent buoyant, CEM fractions, and fractions 8–12 bulk proteins with HSP90 as a marker. (B) HEK293 cells were transfected with WT and F92A–Cav-1 cDNAs and lysates subjected to sucrose fractionation and Western blotting as in A. (C) BAECs were infected as described in A, lysed, and subjected to velocity gradient centrifugation to compare the relative MW of Cav-1 container oligomers. (quantified by densitometry above). Gradients were calibrated with known MW standards. Fractions were blotted for endogenous Cav-1 (top), WT Cav-1 (middle), and F92A–Cav-1 (bottom). The peak level of Cav-1 was in fraction 6 consistent with greater than 10 monomers of Cav-1 (each monomers in 22 kDa). (D) Expression of WT and F92A–Cav-1 cDNAs in HEK293 cells that express low levels of endogenous Cav-1. Samples were processed as described in C. Similar results were obtained in 2 additional experiments.

