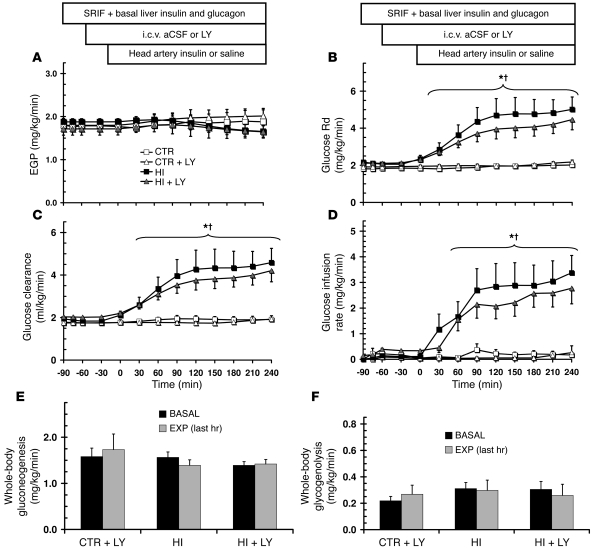
Figure 6. Effect of the head artery insulin infusion protocol on tracer-derived glucose flux parameters.
(A) EGP. (B) Glucose Rd. (C) Glucose clearance. (D) Glucose infusion rate. (E) Whole-body gluconeogenesis. (F) Whole-body glycogenolysis. Values are mean ± SEM. (A–D) n = 4 (CTR and CTR+LY); 8 (HI); 7 (HI+LY). (E and F) n = 3 (CTR+LY); 4 (CTR, HI, and HI+LY). *P < 0.05, HI and HI+LY vs. CTR and CTR+LY; †P < 0.05, HI and HI+LY vs. basal period.

