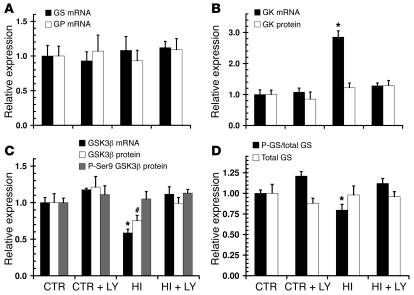
Figure 8. Effect of the head artery insulin infusion protocol on markers of glucose uptake and glycogen metabolism.
(A and B) Selective head hyperinsulinemia did not regulate GS or GP mRNA (A) and increased GK mRNA expression, but did not alter GK protein levels (B). (C and D) GSK3β protein and mRNA expression were both reduced in HI animals (C), and there was a corresponding suppression of GS phosphorylation (D); these effects were blocked in the HI+LY group. Values are mean ± SEM. n = 4 (CTR and CTR+LY); 8 (HI); 7 (HI+LY). *P < 0.05 vs. all other groups; #P < 0.05 vs. CTR and CTR+LY.

