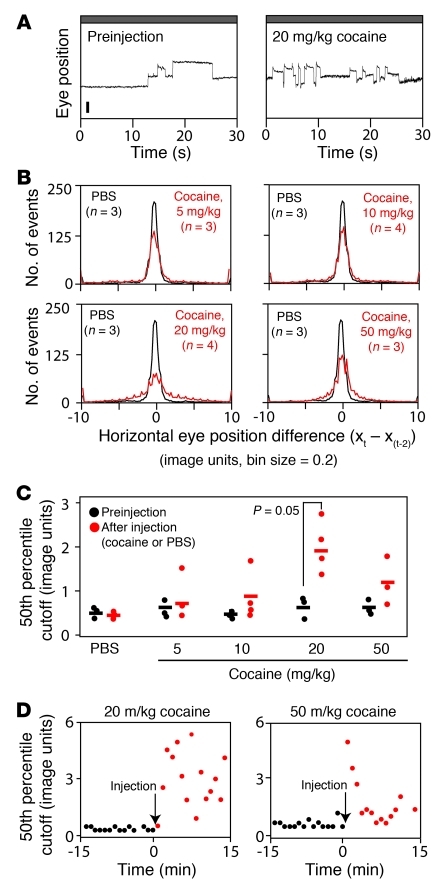
Figure 5. Quantifying the increase in spontaneous eye movements induced by cocaine.
(A) Representative 30-second records of spontaneous eye movements (i.e., with no moving visual stimulus) recorded prior to and after an i.p. injection of 20 mg/kg cocaine. The box-car shape of the eye movements is retained, but the frequency of movements increases after cocaine administration. (B) Histograms for individual mice showing horizontal eye position differences between time points separated by 2 seconds (Xt–Xt–2) and sampled at 16.7-millisecond intervals. Data are the Xt–Xt–2 averages for the 15 minutes immediately after i.p. injection of PBS (black) or cocaine (red) at the indicated doses. n indicates the number of mice averaged per condition. Horizontal eye position (x) is plotted in “image units,” a distances measure in the video image. (C) 50th percentile cutoff value for the Xt–Xt–2 distributions for each mouse. Horizontal bars represent the mean. Individual symbols represent individual mice. (D) Time course of spontaneous eye movements plotted for each 30-second recording interval; the interleaved 30-second intervals with moving black and white stripes were omitted from the analysis. Spontaneous eye movements are quantified as in C. Individual symbols represent individual mice. Data are presented as the mean ± standard deviation.

