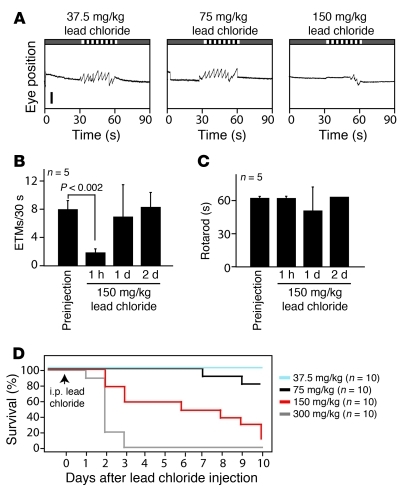
Figure 9. Acute lead toxicity inhibits the OKR.
(A) Representative 90-second OKR records 1 hour after the indicate dose of lead chloride delivered i.p. Five mice were tested at each dose. Scale bar: 0.5 mm. (B and C) Quantification of (B) ETM30 and (C) rotarod performance at different times before and after a single injection of 150 mg/kg lead chloride (n = 5 mice). (D) Kaplan-Meier survival curve for a single i.p. dose of lead chloride at the indicated doses (n = 10 mice per group). Data are presented as the mean ± standard deviation.

