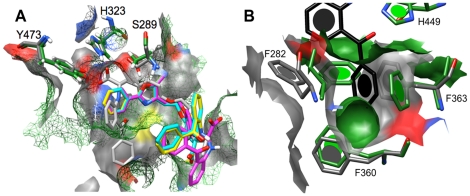
Figure 7. Visual assessments of molecular surface differences that result in unsuccessful docking of specific ligand types to the selected PPARγ structure model.
Farglitazar is represented in both panels with atom-specific coloring. (A) 1ZGY and 1FM9 surface representations are green mesh and solid gray, respectively. The three poses predicted for farglitazar relative to 1ZGY are shown in magenta, cyan, and yellow. (B) Side chain rotamers for F282 and F363 are responsible for the differences in cavity surface at the rear of the cavity. Surface colors for 1ZGY and 1FM9 are the same as in (A). Atom-specific coloring: gray/black = carbon, blue = nitrogen, red = oxygen, white = hydrogen, and yellow = sulfur.

