
Figure 4.
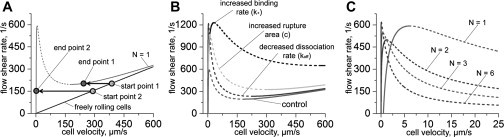
Adhesion bistability. (Solid and dashed lines) Stable and unstable solutions, respectively. (A) Bistable curve for the case of nonclustering proteins (N = 1, gray curve) and for freely rolling cells (black line) are shown. The curve minimum determines the catching effectiveness of adhesion proteins while the maximum determines the largest shear rate that adhesion bonds can withstand. (B) Influence of the model parameters on the velocity-shear rate curve shape. (Control curve is the same as the gray curve on panel A.) For the decreased-dissociation curve, the bond dissociation rate was taken to be 10 times smaller than in Table 1, i.e., koff = 0.5 s–1. For the increased-binding curve the bonds formation rate was taken to be 10 times bigger than in Table 1, i.e., k+ = 0.1 μm2/s. For the increased-rupture-area curve, the rupture area size is c = 350 nm. (C) Influence of proteins clustering on the velocity-shear rate curve. Curves for different numbers (N) of proteins in adhesion sites are shown. Values of the model parameters used in calculations for panels A and C are shown in Table 1.