
Figure 3.
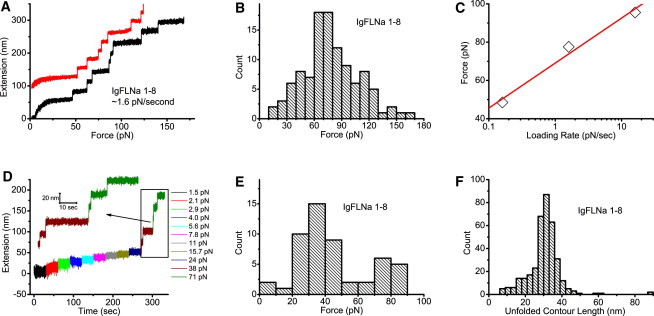
(A) Two representative unfolding processes of IgFLNa 1–8 under a fixed loading rate of ∼1.6 pN/s. An extension offset of 100 nm is applied to the upper curve. (B) Histogram of the unfolding forces of IgFLNa 1–8 under a constant loading rate of ∼1.6 pN/s. The distribution peak is at ∼70 pN. (C) Peak unfolding forces for IgFLNa 1–8 under three different loading rates. The solid line is a linear fit of the three experimental data points. (D) Representative time course of the unfolding process of IgFLNa 1–8 under constant forces indicated by the different colors. At each force, the tether was held for 30 s. (E) Histogram of the unfolding forces of IgFLNa 1–8 from 52 unfolding events obtained according to the procedure in D. (F) Histogram of the unfolded contour length of IgFLNa 1–8.