
Figure 6.
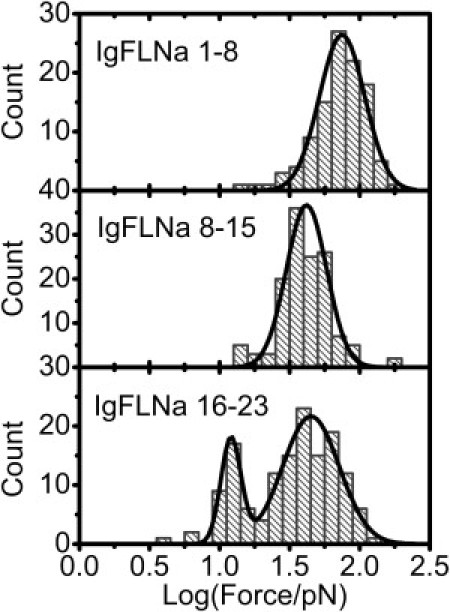
Histograms in logarithm scale of unfolding forces for IgFLNa 1–8 (upper), IgFLNa 8–15 (middle), and IgFLNa 16–23 (lower) at a loading rate of ∼1.6 pN/s. Solid curves are results of Gaussian fitting of the distribution peaks.
Official websites use .gov
A
.gov website belongs to an official
government organization in the United States.
Secure .gov websites use HTTPS
A lock (
) or https:// means you've safely
connected to the .gov website. Share sensitive
information only on official, secure websites.
Histograms in logarithm scale of unfolding forces for IgFLNa 1–8 (upper), IgFLNa 8–15 (middle), and IgFLNa 16–23 (lower) at a loading rate of ∼1.6 pN/s. Solid curves are results of Gaussian fitting of the distribution peaks.