
Figure 1.
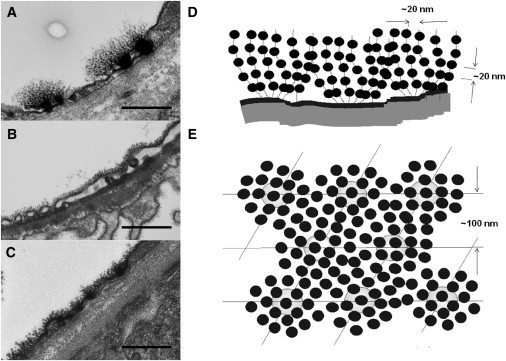
Three TEM rat tissue examples of glycocalyx, from the jejunum capillary (A), the glomerular capillary (B), and the peritubular capillary (C), stained using the Rostgaard perfusion technique (17), with a previously proposed model from Squire et al. (12) (printed with permission); scale bar, 500 nm. (D) Model from the same view as for A–C. (E) Same model as in D from the planar view. The spacings shown in the model are from the predominant peaks from frog mesentery. The mean spacing between the fibers was found to be 20 nm, but regularity was limited to one or two orders in most cases, presumably by a fluid model (nearest-neighbor) system. The 100-nm spacing was proposed to be from glycocalyx tufts linked to an underlying cytoskeletal array of filaments such as actin.