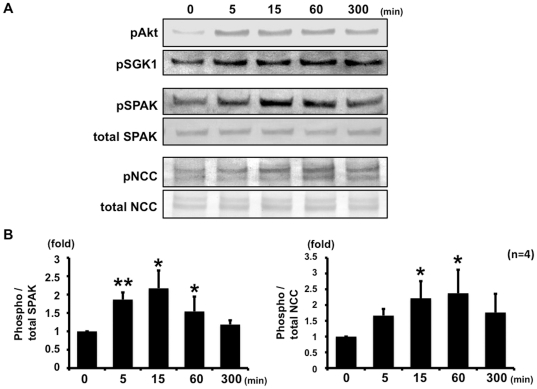
Figure 1. Time-course of insulin-stimulated SPAK and NCC phosphorylation in mpkDCT cells.
A. Representative blots of phosphorylation of SPAK and NCC by 100 nM insulin in mpkDCT cells. Insulin increased phosphorylation of SPAK and NCC, as well as Akt and SGK1. B. Densitometry analysis of phosphorylation of NCC by insulin in mpkDCT cells. Values (n = 4) are expressed as the ratio to the signals in insulin-free samples. The level of SPAK phosphorylation increased to the maximal extent at 15 min and returned to the basal level after 300 min. On the other hand, the level of NCC phosphorylation increased to the maximal extent at 60 min. *P<0.05, **P<0.01.

