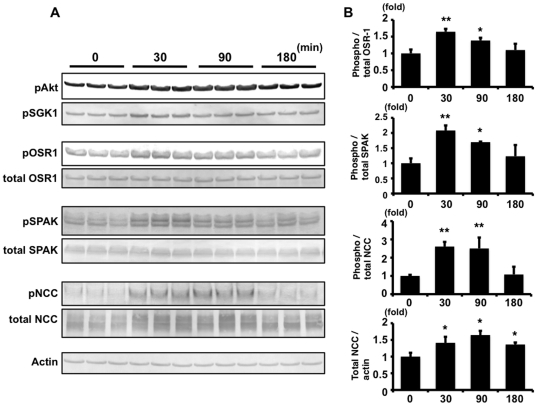
Figure 8. Time-course of insulin-stimulated OSR1, SPAK and NCC phosphorylation in insulin-stimulated mouse kidney.
A. Immunoblots of the time-course of OSR1, SPAK and NCC phosphorylation in the kidney from insulin-stimulated mice on a high-salt diet. Thirty minutes after injection of insulin to mice, phosphorylation of OSR1 and SPAK increased to the maximal degree. NCC phosphorylation increased to 2.6-fold (p<0.01) at 30 min after insulin injection, and it was sustained for at least 90 min. Increased total NCC protein was also sustained in insulin-injected mouse kidney for least 180 min. Phosphorylation of Akt and SGK1 was also increased to the maximal degree at 30 min after insulin injection. B. Densitometry analyses of phosphorylation of OSR1, SPAK, NCC and total NCC protein in the kidney. For densitometry analysis, values (n = 3) are expressed as the ratio to the average of the signals in the vehicle group. *P<0.05, **P<0.01.

