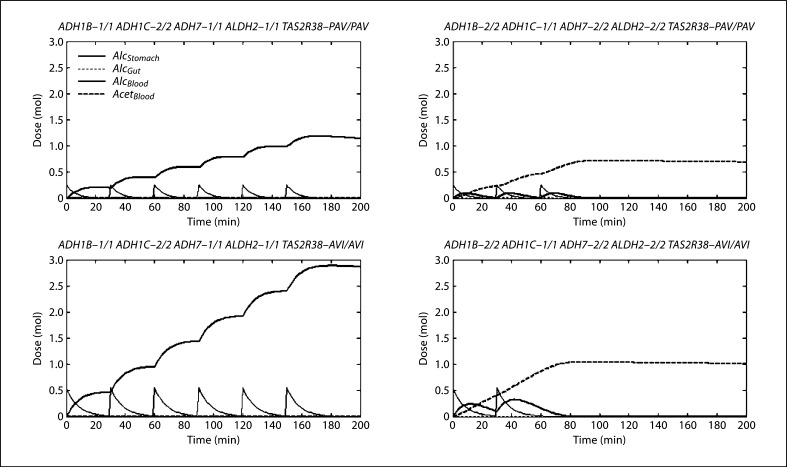
Fig. 5.
Ethanol-acetaldehyde profiles. These profiles were chosen because they represent extreme genotypes. The left column represents the putative non-protective form of all the metabolism genes, while the right column represents the putative protective multilocus genotype. The top represents the ancestral TAS2R38 genotype, consuming standard drinks, while the bottom represents the derived TAS2R38 genotype, consuming larger drinks. Each spike in stomach alcohol represents the consumption of a drink.

