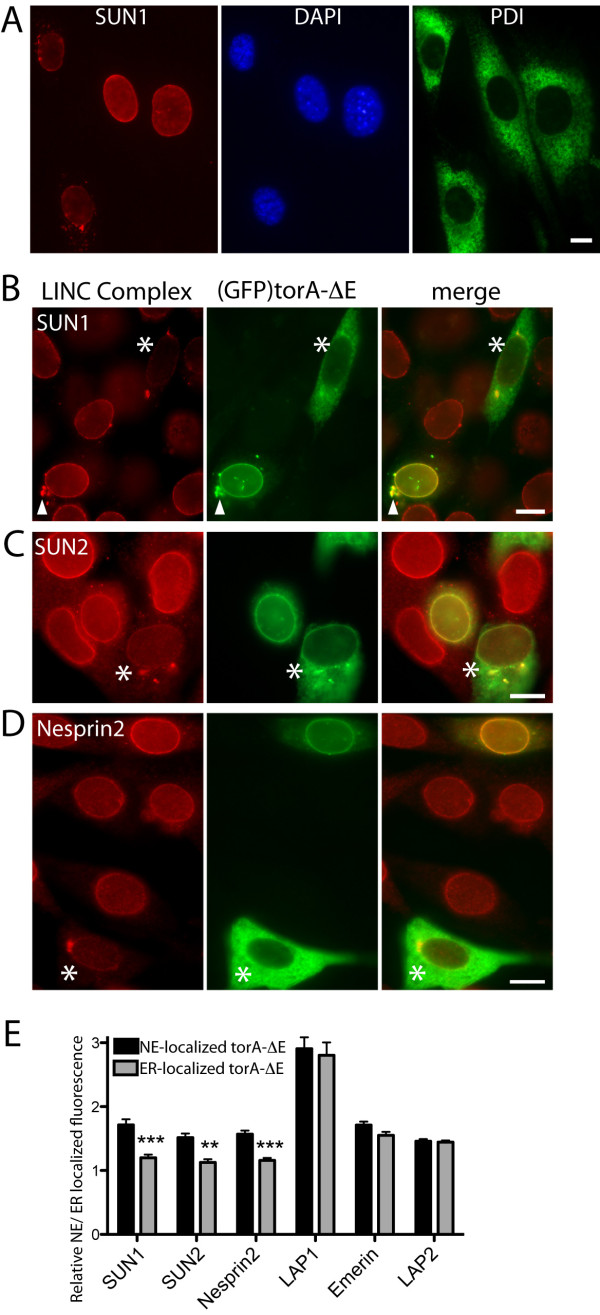
Figure 2.
TorA-ΔE co-localizes with LINC complex components. A) SUN1 localization in the NE varies between individual NIH-3T3 cells. Panels show anti-SUN1 (red), DAPI labeling of DNA, anti-PDI labeling of the ER (green) in sub-confluent, unsynchronized NIH-3T3 cells. Scale bars show 10 μm. (B - D) Positive correlation between the localization of LINC complex components and transfected (GFP)torA-ΔE. Left panels (red) show (B) anti-SUN1, (C) anti-SUN2, and (D) anti-Nesprin2 labeling of NIH-3T3 cells. Middle panels (green) show the subcellular localization of transfected (GFP)torA-ΔE. * symbols highlight that cells with ER-localized (GFP)torA-ΔE also lack NE-localized LINC proteins. White arrowheads highlight that transfected (GFP)torA-ΔE also colocalizes with SUN1 outside the NE. (E) Ratios of NE/ER localized anti-SUN1, SUN2 and Nesprin2 fluorescence are higher in cells with NE-localized (GFP)torA-ΔE. Columns show the mean and s.e.m. of the relative NE/ER localized anti-SUN1, SUN2, Nesprin2, LAP1, emerin and LAP2 fluorescence from n > 15 cells. Black columns show the ratios of NE/ER fluorescence from cells with predominantly NE-localized (GFP)torA-ΔE, while grey columns show ratios from cells with ER-localized (GFP)torA-ΔE. ***, ** indicate that the mean ratio of NE/ER fluorescence is significantly (p < 0.001, 0.01) different between cells with NE- or ER-localized (GFP)torA-ΔE (Two-Way ANOVA with Bonferroni post-hoc analysis).

