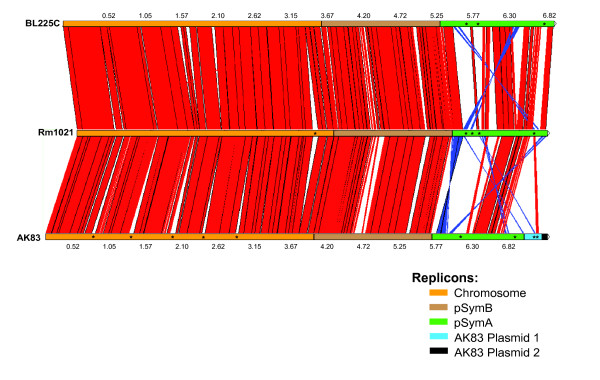
Figure 3.
Structure of S. meliloti genomes: genomic alignment of strain BL225C (top), Rm1021 (middle) and AK83 (bottom) with each replicon highlighted by different colours. The size is expressed in Mbp. Red connections indicate syntenic regions, blue ones inversions, asterisks indicate the regions containing transposases as discussed in the text.

