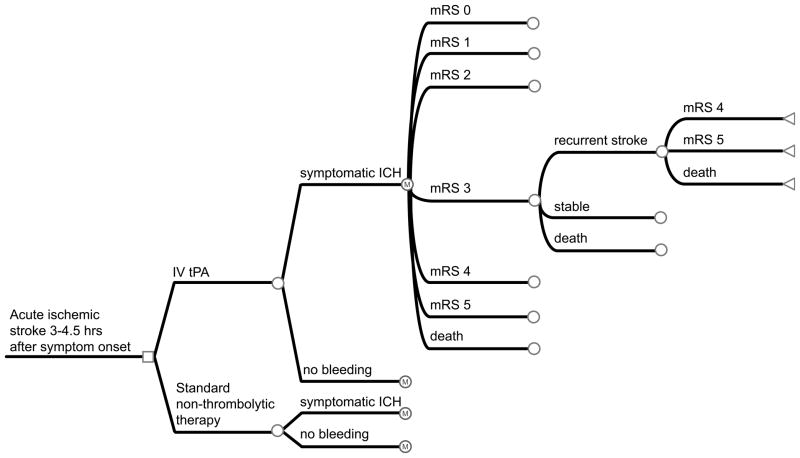
Figure 1. Decision-analytic tree and Markov state-transition model.
A patient enters the model when they are admitted to the hospital and receive either tPA or non-thrombolytic therapy within 3 to 4.5 hours after the onset of stroke symptoms. After the initial stroke, the patient may remain in the same health state, have a recurrent stroke and transition to a lower health state, or die. Death can occur at any point in the process. Square nodes represent decision nodes. Circle nodes represent chance nodes with Markov nodes where indicated. Triangular nodes represent terminal nodes with corresponding transition states.

