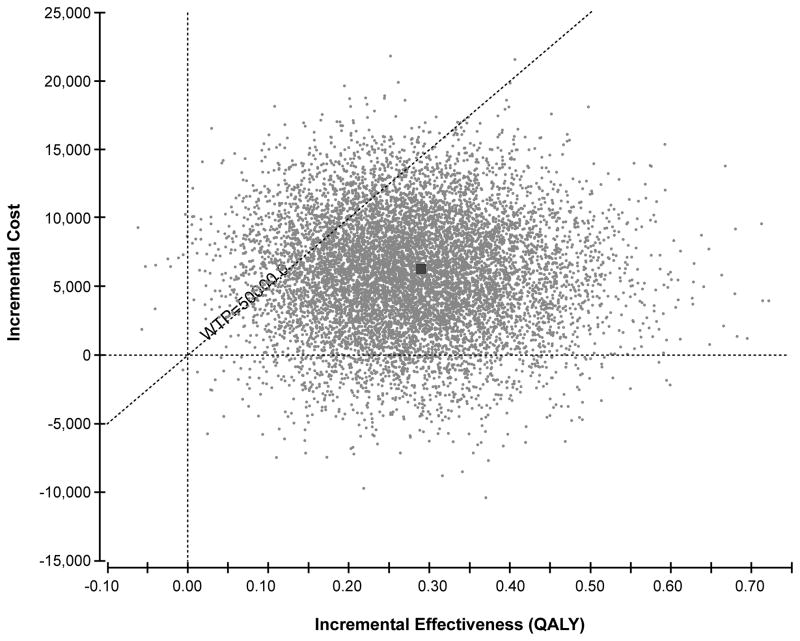
Figure 3. Results of probabilistic sensitivity analysis: incremental cost-effectiveness scatter plot.
Incremental effectiveness is measured in QALYs. The dotted diagonal line represents the willingness to pay threshold of $50,000 per QALY. All points to the right of the willingness to pay line are considered cost-effective. Each point represents a simulation run. The dark square represents the base case result (0.28 QALYs gained at an incremental cost of $6,050).

