Figure 7.

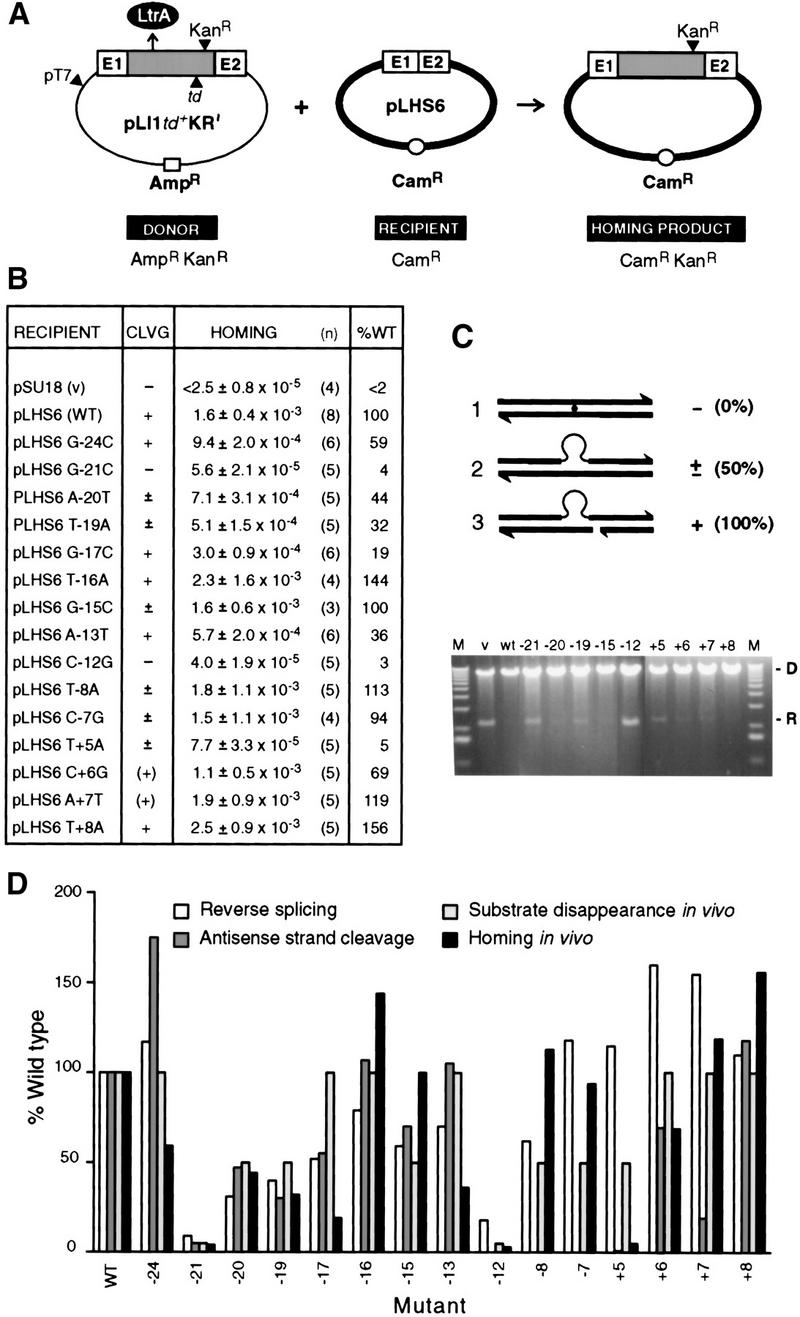
In vivo properties of mutant target sites. (A) Genetic retrohoming assay. Crosses between the AmpRKanR donor (pLI1td+KR′) and CamR recipients (pLHS6 derivatives) allowed selection for CamRKanR homing products. (Shaded box) Ll.LtrB intron; (LtrA) product of intron ORF; (td) group I intron; (E1 and E2) exons. (B) Summary of assay data. Homing frequency is defined as the number of CamRKanR homing products per CamR recipient. (n) Number of trials; (WT) wild-type target site. Cleavage (CLVG), assayed by substrate disappearance, is represented as −, ±, and + as defined in C. Parentheses for the +6 and +7 mutants indicate some variability among experiments. (C) Target-site cleavage assay. Donor (D) and recipient (R) DNAs were extracted from aliquots of cultures 3 hr after IPTG induction, linearized, and separated in a 1% agarose gel. Representative data show persistence of substrate, [(−); −21, −12], partial disappearance of substrate [(±); −20, −19, −15, +5], and virtually complete disappearance of substrate [(+); +6, +7, +8]. Schematics at top depict uncleaved (1), an example of partially cleaved (2), and completely cleaved (3) target. (V) Vector; (M) molecular weight markers. (D) Comparison of in vivo and in vitro data. Reverse splicing and antisense-strand cleavage in vitro from Figs. 2 and 5 are compared with substrate disappearance and homing in vivo for indicated mutant target sites. The data are represented in the histogram as a percentage of the wild-type target site. Substrate disappearance is arbitrarily represented as 100% for +, 50% for ±, and 5% for −. Antisense-strand cleavage assays were not performed for the −12, −8, and −7 substrates, and those positions of the histogram have been left blank.
