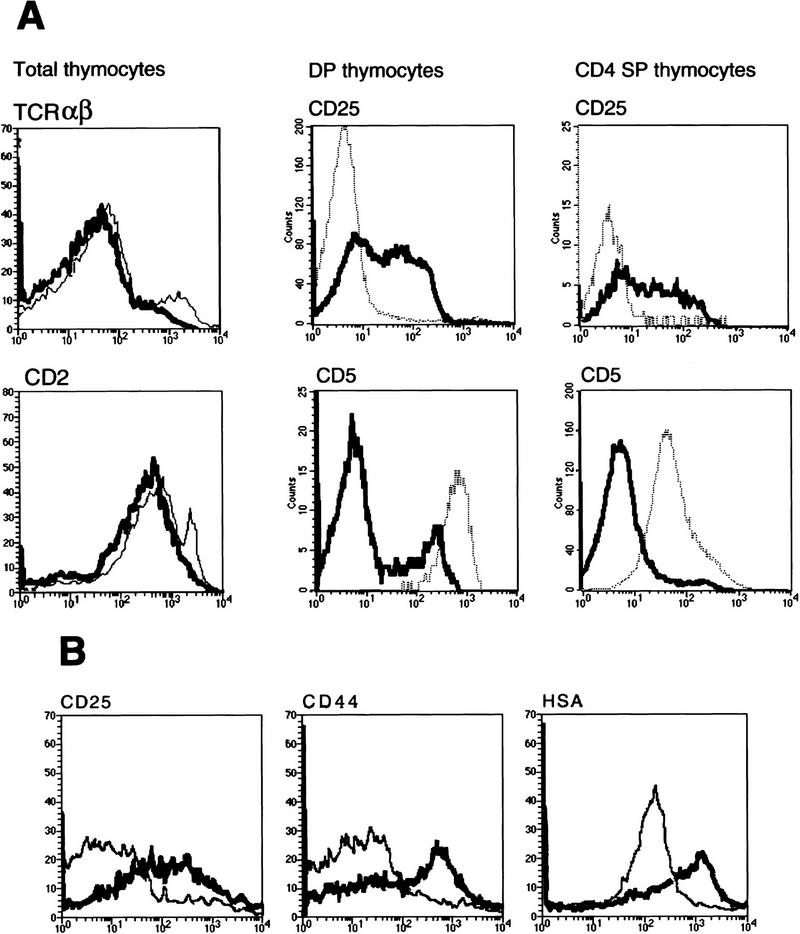
Figure 6.
Dysregulated expression of certain developmental marker proteins in SATB1-null thymocytes and T cells. (A) Total thymocytes from wild-type and SATB1-null thymi were stained with a biotin-conjugated anti-CD2/Cy-chrome–streptavidin combination or Cy-Chrome-conjugated anti-TCRαβ antibody alone. CD5+ and CD25+ thymocytes in both CD4+ CD8+ DP and CD4+ SP populations were detected by PE-conjugated anti-CD8 antibody and biotin-conjugated anti-CD4 antibody/Tri-Color-streptavidin combined with either FITC-conjugated anti-CD5 antibody or FITC-conjugated anti-CD25 antibody. (B) Peripheral T cells from wild-type and SATB1-null lymph nodes were stained singly with FITC-conjugated anti-CD25 antibody, biotin-conjugated anti-CD44 antibody/Cy-Chrome–streptavidin, and biotin-conjugated anti-HSA antibody/Texas Red–streptavidin and analyzed by FACS. For histogram analysis, CD4−CD8− double negative cells were excluded by gating. In all histograms the bold line represents the distribution of 1 × 10⁴ stained T cells from SATB1-null mice while the staining distribution of T cells from control littermates is depicted by the curve with a narrow line.

