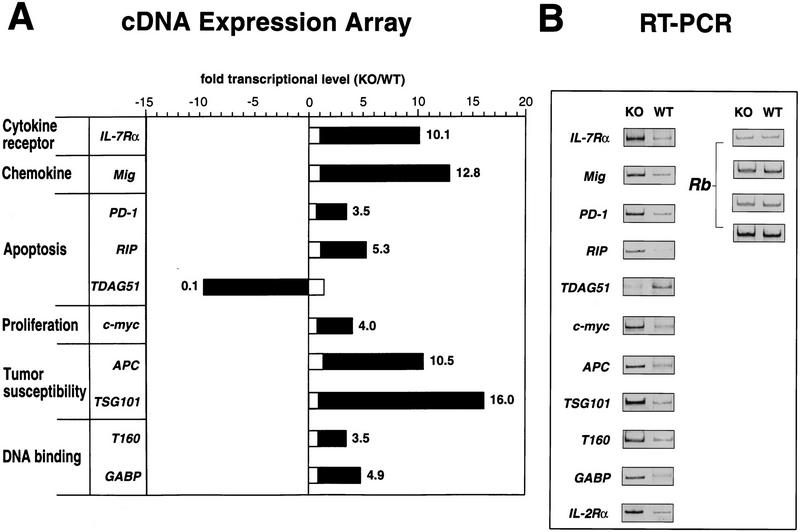
Figure 8.
Dysregulation of multiple genes in SATB1-null thymocytes. (A) Genes that exhibited a >3.5-fold difference in their mRNA levels between SATB1-null and wild-type thymi based on Atlas mouse cDNA Expression Array and confirmed by RT–PCR are shown by solid bars. The ratio of these transcripts between knockout and wild-type liver are shown by open bars. (B) The RT–PCR results for these genes as well as IL-2Rα, which was not included in the expression array, are shown (see Materials and Methods). The Rb gene, which is expressed at a similar level in SATB1-null and wild-type thymocytes, was used as a control under varying RT–PCR conditions.

