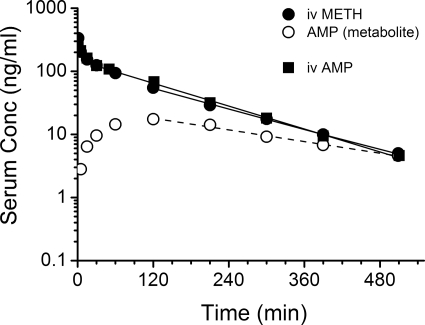
Fig. 3.
Serum concentration (Conc) versus time curve of AMP from one animal representative of the average pharmacokinetics after an intravenous bolus dose of 1 mg/kg AMP to pregnant rats on GD21 and the serum concentration versus time curves of METH and its metabolite AMP (from Fig. 4) after a 1-mg/kg METH dose on GD21. The best-fit lines for the serum concentration versus time profile of intravenous METH and intravenous AMP (solid line) and AMP metabolite (dashed line) were determined by a noncompartmental model in the terminal elimination phase.

