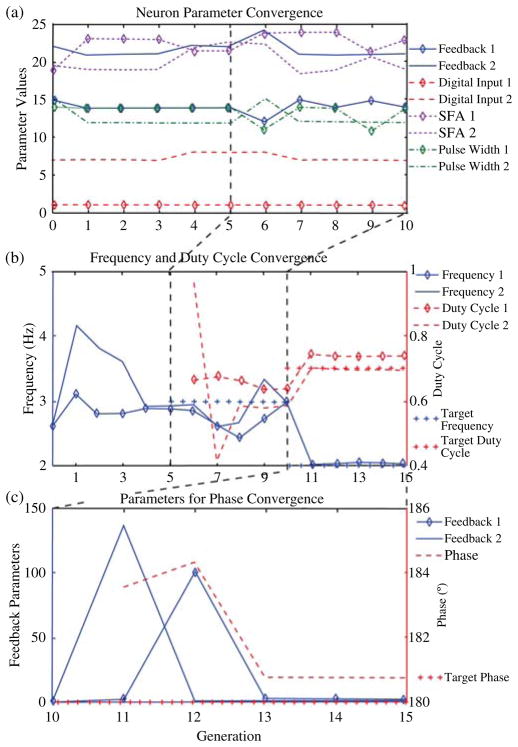
Fig. 10.
Evolution of parameters during optimization. Each stage of evolution runs for five generations. The transition between stages is shown by the dashed lines. Note that the target frequency varies between stages. (a) Results of neuron parameter evolution over stage 1 and stage 2. (b) Results of frequency and duty cycle convergence over stages 1–3. (c) Results of parameter evolution for phase convergence in stage 3.

