
Fig. 4. Position-dependent rewrapping rates measured by FRET-FCS.
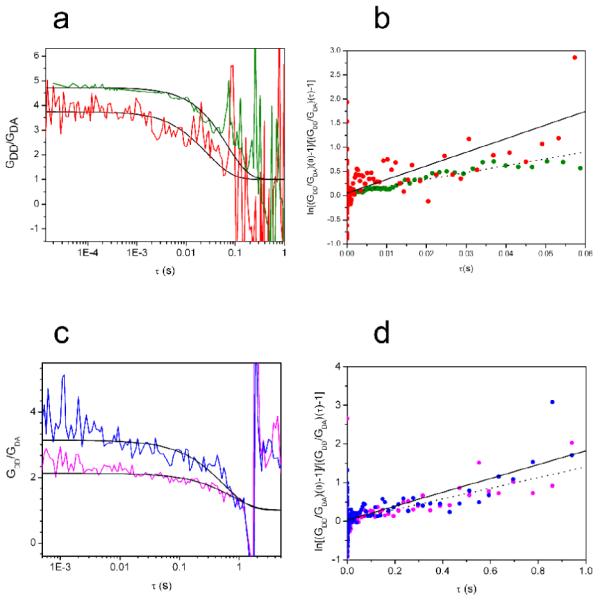
(a) Ratios of donor-donor autocorrelations to donor-acceptor cross correlations, plotted versus lag time (log scale). Red, results for Cy3-1 system, reported elsewhere40; green, results for Cy3-35 system. The characteristic decay time of such curves is the reciprocal of the sum of the unwrapping and rewrapping rate constants (k12 + k21), which is dominated by the rewrapping rate, yielding k21 directly. The solid lines represent theoretical predictions using k21 = 21 sec−1 for Cy3-1, in good agreement with our earlier measurement of 20 sec−1 which was obtained using a different FRET-FCS approach;16 and using k21 = 15 sec−1 for Cy3-35. (See Methods for additional details.) (b) At long delay times the logarithm of the ratio function decays of panel (a) becomes linear, with a slope that equals the reciprocal of the relaxation time independently of other experimental variables. Red and green data points from the curves of panel (a). Lines represent linear fits from which the rates used for the modeling of panel (a) were obtained. (c) As in panel (a) except for the Cy3-57 and Cy3-69 systems (blue, magenta, respectively). Lines represent theoretical predictions using k21 = 1.8 sec−1 for Cy3-57, and using k21 = 1.4 sec−1 for Cy3-69. (d) As in panel (b) but for the Cy3-57 and Cy3-69 systems (blue, magenta, respectively), with linear fits.