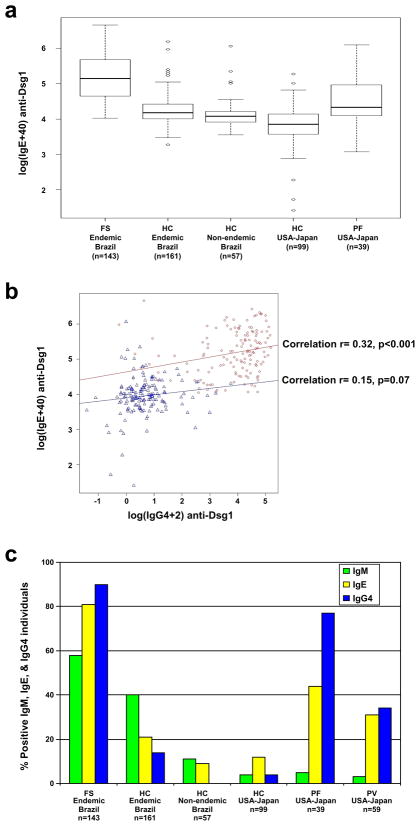
Figure 1. IgE and IgG4 anti-Dsg1 in Fogo Selvagem patients and Control groups.
Panel a: Box plots of IgE anti-Dsg1 in FS and PF patients and healthy controls (HC). The horizontal lines within the box plots indicate the median values; the lower and upper ends of the boxes represent the 25th and 75th percentiles. Panel b. The correlation between anti-Dsg1 IgE and IgG4 in FS patients and healthy controls. Blue triangles and blue line, healthy controls; red circles and red line, FS patients. Panel c. IgM, IgE and IgG4 anti-Dsg1 in FS, PF, PV, BP and healthy controls (HC). Percentages of positive anti-Dsg1 sera for each group are shown in green bars (IgM), yellow bars (IgE) and blue bars (IgG4).

