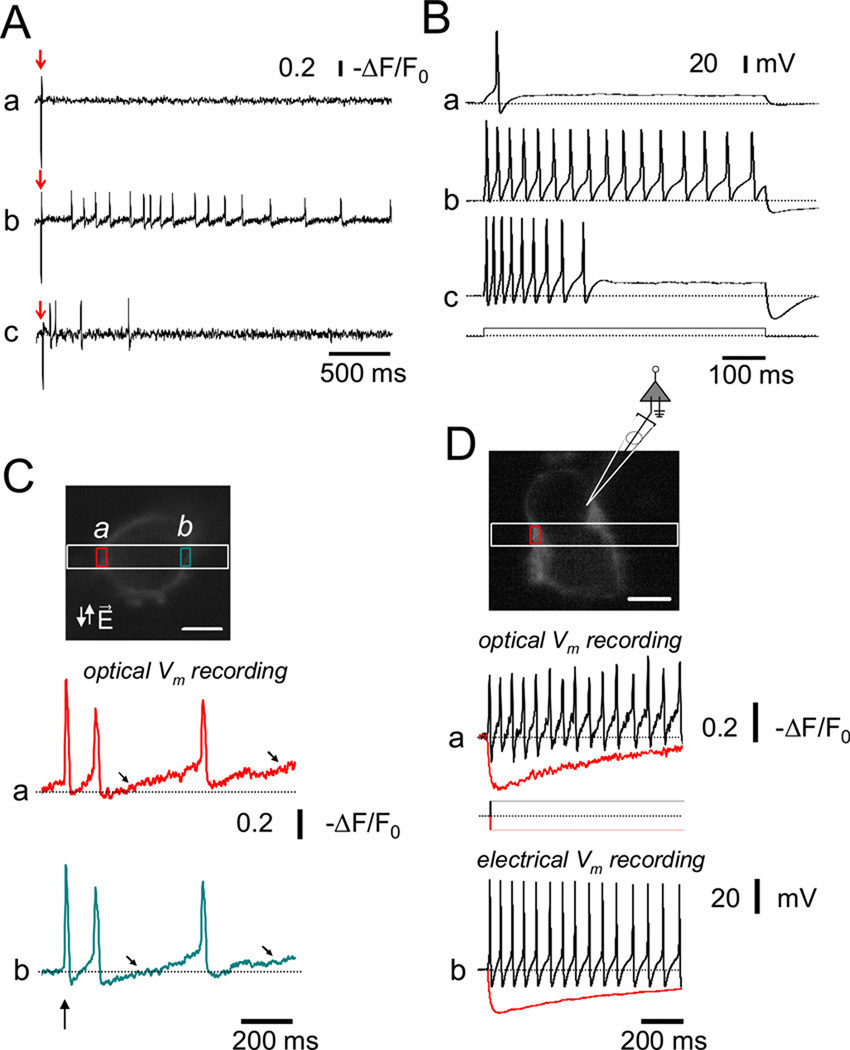
Figure 3.
Phasic and repetitive firing patterns in 24 hr cultured rat SCG neurons. (A) Representative action potential recordings from phasic (a), and repetitively firing neurons (b–c) using annine-6, a fast response voltage-sensitive dye (see Material and Methods). In each neuron, action potentials were elicited by single 2ms suprathreshold field stimuli (indicated by arrows). (B) Action potentials in response to long (800 ms) suprathreshold depolarizing current steps (400 pA) were recorded in current-clamp mode from three 24 hr cultured SCG neurons (Figure 3B a–c). Based on the response(s) to these current injections, neurons were classified as either phasic (a), or repetitively firing (b and c). After 24 hr in culture, ~48 % of the SCG neurons responded with a single AP or displayed phasic firing (i.e. firing up to 3 action potentials in response to long, suprathreshold current injections). Repetitive firing was observed in the remaining ~52 % of the neurons evaluated in this study (n = 48). (C) Top. Fluorescence of an annine-6 stained 4 day cultures SCG neuron scanned in x–y mode. A band scan (512× 30 lines; 723 fps; 1.3 ms per frame) was acquired at the region enclosed by the white rectangle. During the band scan a single 2 ms field stimulus (vertical arrow) was applied and the time course of the fluorescence (a) and (b) was evaluated at the plasma membrane in two AOI’s (a and b, red and cyan boxes on xy image, respectively). A slow depolarization (diagonal arrows) followed the first action potential initiated by a single 2 ms field stimulus (vertical arrows). (D) Simultaneous recording of optically and electrically measured membrane potential signals from an annine-6 stained and current-clamped SCG neuron. Top. Fluorescence of a different annine-6 stained and voltage-clamped SCG neuron scanned in x–y mode. The cartoon illustrates the position of the patch pipette and the AOI (red box) used for the evaluation of the time course (a) of annine-6 fluorescence during either negative (red trace) or positive (black trace) current steps. (b) Membrane potentials measurements acquired with the current protocol illustrated at the middle of the panels. Note the agreement between the optically and electrically recorded membrane potentials.

