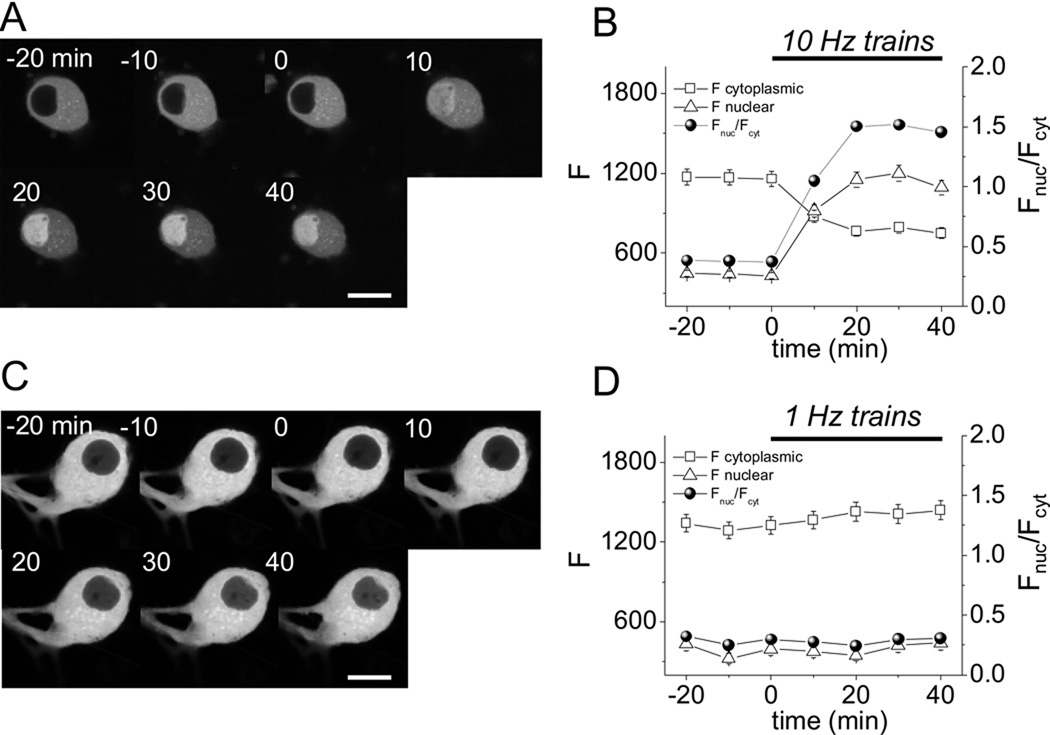
Figure 9.
Time course of NFATc1 nuclear translocation for repetitive 5 s trains of 10 Hz or 1 Hz electric field stimuli. (A) NFATc1-CFP fluorescence images of the same SCG neuron before (−20 to 0 min) and during (0 to 40 min) repetitive electrical field stimulation with 5 s trains of 10 Hz stimuli applied once every 50 s. (B) Time course of cytosolic (open square) and nuclear (open triangle) mean pixel fluorescence (arbitrary units, left scale), and the ratio of nuclear to cytosolic (Fnuc/Fcyt) mean pixel fluorescence (filled circles, right scale). 10 Hz train stimulation produces a marked redistribution of NFATc1-CFP from cytoplasm to nucleus (n = 12). (C and D), same as A and B, but using 5 s trains of 1 Hz stimuli applied every 50 s, which produces no appreciable translocation of NFATc1-CFP from cytoplasm to nucleus (n = 8). Neurons were selected to have cytoplasmic fluorescence between 1000 and 1800 to minimize effect on expression levels. Scale bar 10 µm.

