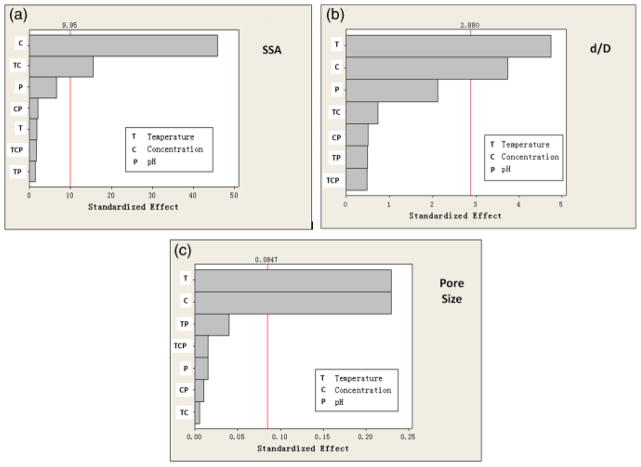
Fig. 7.
Pareto charts showing the standardized effect for the process variables and their significance on (a) the specific surface area (SSA), (b) ratio of hollow core diameter to the microsphere diameter (d/D), and (c) pore size of the microsphere wall. T, temperature; C, concentration of K2HPO4 solution; P, pH value.

