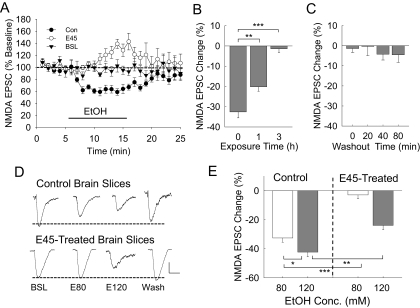
Fig. 1.
Adaptive change of the NMDAR response to the effects of 80 and 120 mM ethanol application in hippocampal brain slices. A, time course of NMDAR current responses during whole-cell recordings from control (Con, n = 8) or 3-h 45 mM ethanol-treated (E45, n = 7) brain slices. To demonstrate the stability of the recordings, whole-cell patched CA1 neurons were superfused with normal aCSF for these baseline recordings (BSL, n = 6), without application of the 80 mM ethanol. B, brain slices were exposed to 45 mM ethanol ex vivo for 0, 1, or 3 h. The NMDAR current responses to short-term 80 mM ethanol application were recorded. Some resistance of NMDAR currents to 80 mM ethanol inhibition already occurred after 1 h of the 45 mM ethanol exposure, and maximum resistance was seen after 3 h of exposure. The number of cells recorded at 0, 1, and 3 h: 18, 7, and 16, respectively. C, after the 3-h 45 mM ethanol exposure, brain slices were superfused with normal aCSF for 0, 20, 40, or 80 min. The 80 mM ethanol inhibition of NMDAR currents was measured in these slices. Short-term ethanol application failed to significantly inhibit NMDAR currents even after 80 min of washout after the 3-h 45 mM ethanol exposure. The number of cells recorded at the 0-, 20-, 40-, and 80-min time periods: 18, 8, 8, and 6, respectively. D, representative traces of NMDAR current responses in neurons from control or 3-h 45 mM ethanol-treated brain slices that were recorded during the application of 80 mM (E80) or 120 mM (E120) ethanol. E, composite graph showing the average ethanol (80 or 120 mM) inhibition of NMDA EPSC amplitude responses from control or 45 mM ethanol-treated brain slices. The number of cells recorded from control neurons, 80 mM ethanol (n = 8); 120 mM (n = 6) and 45 mM ethanol-treated neurons, 80 mM ethanol (n = 7); and 120 mM ethanol (n = 6). One-way ANOVA shows significant differences between groups [F(3,23) = 39.328, p < 0.001]. Scale bars, 50 pA and 100 ms. Significance of the statistical analyses: *, p < 0.01; **, p < 0.005; ***, p < 0.001.

