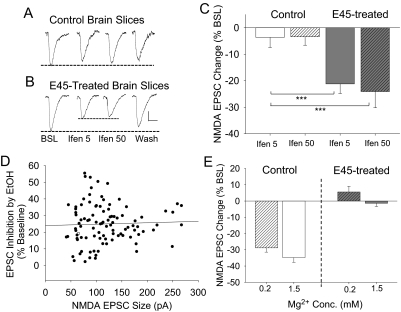
Fig. 2.
The adaptive change in functional NMDAR evoked responses to the effects of 45 mm ethanol treatment is accompanied by ifenprodil inhibition of NMDA EPSCs. Representative traces of NMDA EPSC amplitude during baseline (BSL), a 10-min application of ifenprodil (5 μM, Ifen 5; or 50 μM, Ifen 50), and washout of ifenprodil (Wash) from control (A) and 45 mm ethanol-treated (B) brain slices. The dashed lines indicated the relative sizes of the NMDA EPSC amplitude. C, the composite data show that ifenprodil only alters the cells in slices exposed to the 45 mm ethanol treatment. D, a scatterplot was used to determine whether there is a correlation between the NMDAR current inhibition by 80 mM short-term ethanol and the NMDA EPSC size (n = 101). The line indicates the linear regression of this plot (r2 = 0.00464, p > 0.49). The overall NMDA current amplitude was 121.5 ± 6.33 pA, and the ethanol caused an inhibition of 25.0 ± 1.17%. E, the effect of 80 mM ethanol on NMDA EPSCs recorded under low (0.2 mM Mg2+) or normal (1.5 mM Mg2+) conditions in neurons from control or 45 mM ethanol-treated brain slices. Scale bars indicate 25 pA and 50 ms. ***, p < 0.001.

