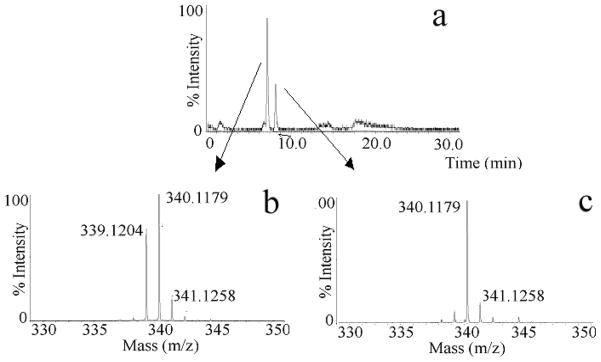
Fig. 2. DEEP-LC-MS analysis to characterize the action of HS C5-epimerase.
Total ion chromatogram of epimerase treated K5NS in D2O is shown. After reaction with C5-epimerase the product was subjected to low pH nitrous acid treatment followed by sodium borohydride reduction. The resulting anhydromannitol disaccharide mixture was desalted using a mini Sephadex-G10 column (1cm × 10 cm) before MS analysis. The first and second peaks correspond to GlcA-AManR and IdoA-AManR, respectively (A, top panel); Mass spectrum of the first peak corresponding to the mixture of HGlcA-AManR and DGlcA-AManR (B, bottom left) and the second peak corresponding to DIdoA-AManR (C, bottom right). Isotopic pattern of a given molecular ion facilitated the estimation of reacted/unreacted disaccharide species.

