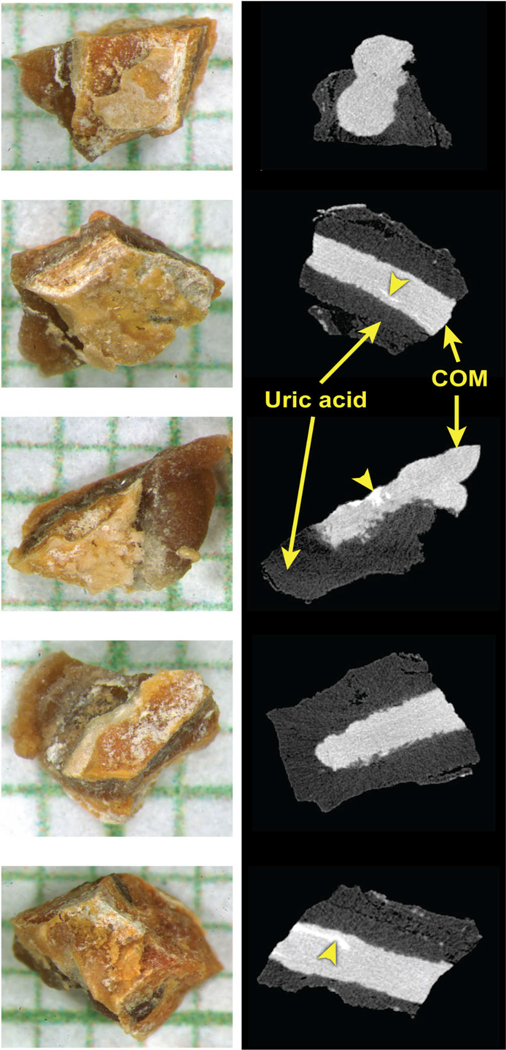
Figure 1.
Example of fragmented stone, showing the samples sent to the 5 laboratories. Images of samples shown on left, on mm grid paper, with representative micro CT slice on right. This stone was mixed uric acid and calcium oxalate monohydrate (COM), which are easily distinguished by micro CT, so that it is certain that each laboratory received a sample containing both materials. Bright white regions (arrowheads) on the micro CT images—seen within the COM—mark areas of apatite, which was present in minor amount in these samples.

