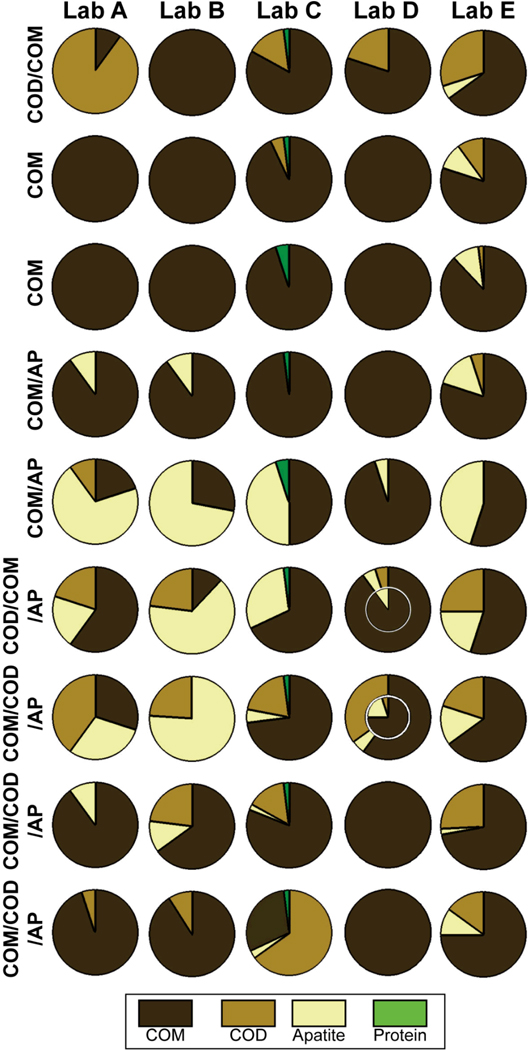
Figure 2.
Results of stone analysis from 5 laboratories (labeled A-E) for 9 calcium oxalate (CaOx) stones. Each row represents a stone that was fragmented into similar samples, one of which was sent to each laboratory. Labels to left indicate composition of stone as determined by micro CT of the original stone and by micro CT-guided dissection and infrared spectroscopy of a sixth sample. Each circle shows composition report by the laboratory; for example, the top left circle shows that Lab A reported the stone as containing 90% COD (CaOx dihydrate) and 10% COM. Nested circles (under Lab D) indicate that report gave details on inner and outer portions of specimen. AP: apatite.

