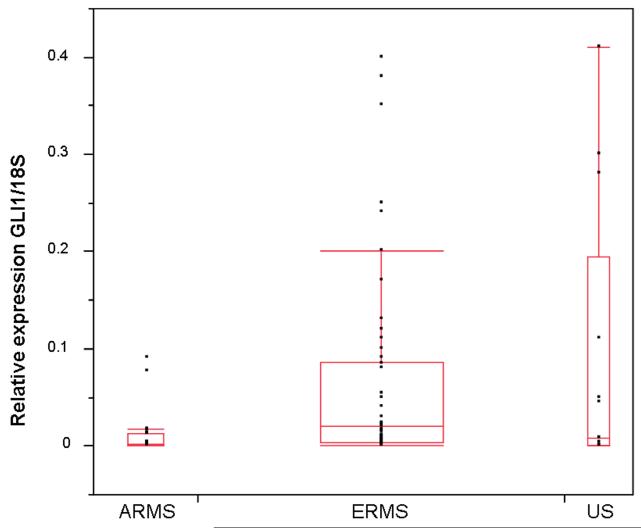
Figure 4. Comparison of GLI1/18S ratios in ARMS, ERMS, and US tumors.
The ratios are depicted in box plots. The median GLI1/18S ratios found are depicted by bars within the squares: ARMS 0.0014, ERMS 0.02, and US 0.0075. The boxes represent the 25th and 75th percentile of GLI1 expression. Standard deviation error bars are shown. Dots represent the distribution of GLI1 tumor expression within each tumor type.

