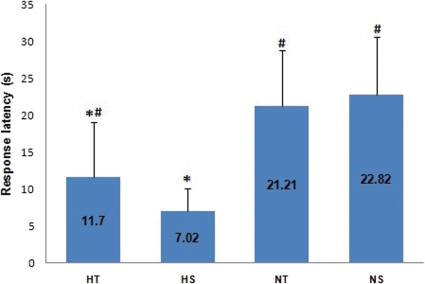
Figure 2.
Response latency of the trained STZ-induced diabetic (HT, n = 11), sedentary STZ-induced diabetic (HS, n = 9), normoglycemic trained (NT, n = 14) and normoglycemic sedentary (NS, n = 16) groups. The Kruskal Wallis test was used. *p<0.01: different from NS and NT; #p<0.05: different from HS.

