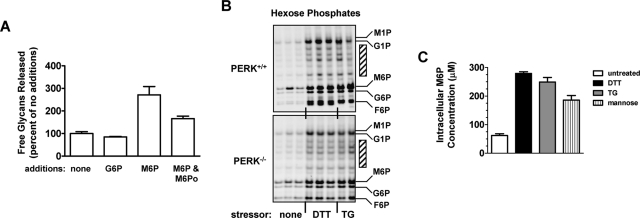
FIGURE 3:
ER stress elevates M6P. (A) SLO-permeabilized normal (MPI+/+) MEFs were incubated 1 h at 37°C with nucleotide sugar LLO precursors in the absence or presence of 100 μM G6P, 100 μM M6P, and/or 200 μM M6Po. Released free glycans (G4–G7 equivalent pool) measured by FACE are expressed as percent of untreated controls (duplicates ± range). (B) FACE gels showing hexose-Ps of PERK+/+ and PERK−/− MEFs, either unstressed (triplicates) or stressed (2 mM DTT [triplicates] or 150 nM TG [duplicates]) for 1 h. Cells were ∼80% confluent. Electrophoresis is top to bottom. Positions of AMAC-conjugated standards are labeled. When required, G1P-AMAC and M1P-AMAC were resolved by running gels longer (e.g., see Figure 6B, upper). Although labeled as hexose-1-Ps for clarity, FACE analysis requires dephosphorylation of M1P and G1P prior to AMAC conjugation. Cross-hatched bars indicate unidentified AMAC conjugates increased by ER stress. (C) Intracellular M6P concentrations (μM) in PERK−/− MEFs (averages of duplicates ± range) after no treatment (white) or treatments with DTT (2 mM, 1 h, black), TG (150 nM, 1 h, gray), or d-mannose (10 mM, 1 h, vertical stripes).

