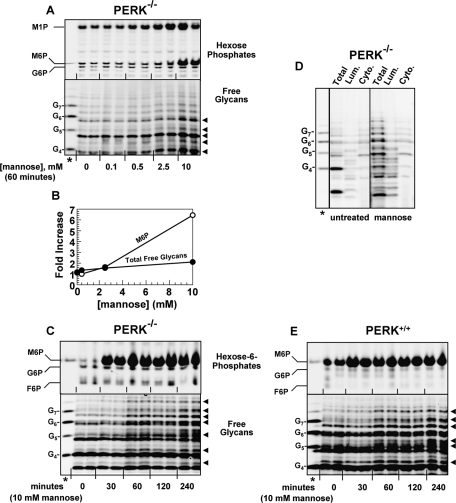
FIGURE 7:
Elevation of M6P in the absence of ER stress releases free glycans. (A–D) PERK−/− MEFs were incubated with (A, B) variable concentrations of mannose for 60 min; (C) 10 mM mannose for variable times; or (D) 10 mM mannose for 60 min. (A and C) Hexose-Ps (top) and free glycans (bottom) as in Figures 3B, 5A, and 6B. Black arrowheads indicate glycans increased by mannose treatment. (B) Quantitative measurements (averages of duplicates) of M6P (white) and total free glycans migrating in the G4–G7 standard range (black) from (A). (D) Lumenal and cytosolic free glycans from untreated or mannose-treated cells were separated, as in Figure 5D. Standard lanes are marked with asterisks. (E) As for (C), with PERK+/+ MEFs.

