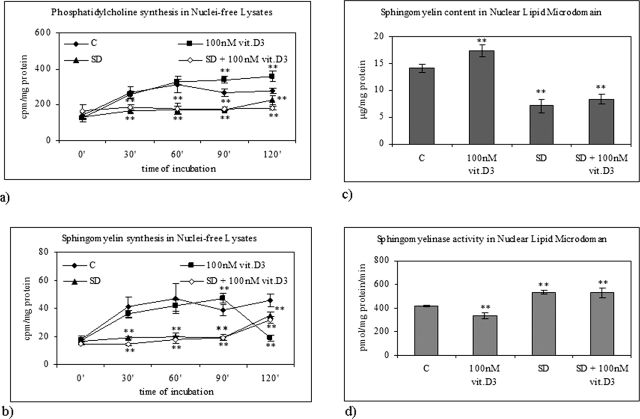
FIGURE 4:
Effect of physiological concentration of vitamin D3 in normal and serum-deprivation condition. (A) PC synthesis and (B) SM synthesis in NFL after 2 h. The data indicating [3H]palmitic acid incorporation in PC and SM are expressed as cpm/mg protein and represent the average ± SD of three experiments performed in duplicate (significance, **p < 0.001 vs. control sample). (C) SM content in NLM after 10 h of culture. The data are expressed as μg/mg protein and represent the average ± SD of three experiments performed in duplicate (significance, **p < 0.001 vs. control sample). (D) SMase activity in NLM after 10 h of culture. The data are expressed as cpm/mg protein/min and represent the average ± SD of three experiments performed in duplicate (significance, **p < 0.001 vs. control sample). C, control; SD, serum deprivation.

