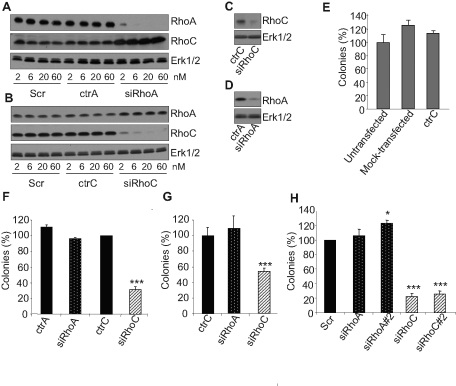
FIGURE 1:
Silencing RhoC but not RhoA repressed anchorage-independent growth. Increasing concentrations (2–60 nM) of Scr, ctrA, and siRhoA (A) or of Scr, ctrC, and siRhoC (B) were used to transfect PC-3 cells. At 48 h posttransfection, cells were lysed and analyzed by immunoblotting with specific antibodies to RhoA, RhoC, and Erk1/2. Strong and specific inhibitions of expression were observed with siRhoA and siRhoC at concentration as low as 2 nM. In sharp contrast, no effect was detected for the controls even at the highest concentrations. PC-3 cells were transfected with 20 nm of ctrC and siRhoC (C) or ctrA and siRhoA (D) and plated in soft agar as described in Materials and Methods. After 2 wk, cellular proteins were extracted and analyzed by immunoblotting with specific antibodies to RhoA, RhoC, and Erk1/2. siRhoA and siRhoC are still efficient after 2 wk of culture in soft-agar. PC-3 (E, F, and H) and LnCaP (G) transfected with 20 nM of the indicated siRNA were plated in soft agar as described in Materials and Methods. SiRhoA#2 and siRhoC#2 were designed and used to assess the specificity of the effects observed with siRhoA and siRhoC, respectively (H). After 2 wk of culture, colonies were counted in the whole-culture dishes. Three independent experiments were performed. Results are expressed in percentage of value obtained with untransfected cells (E), ctrC (F, G), or Scr (H). Only siRhoC is able to significantly reduce the number of colonies. *p < 0.05 and ***p < 0.001, analysis of variance (ANOVA), followed by Tukey–Kramer analysis.

