FIGURE 1.
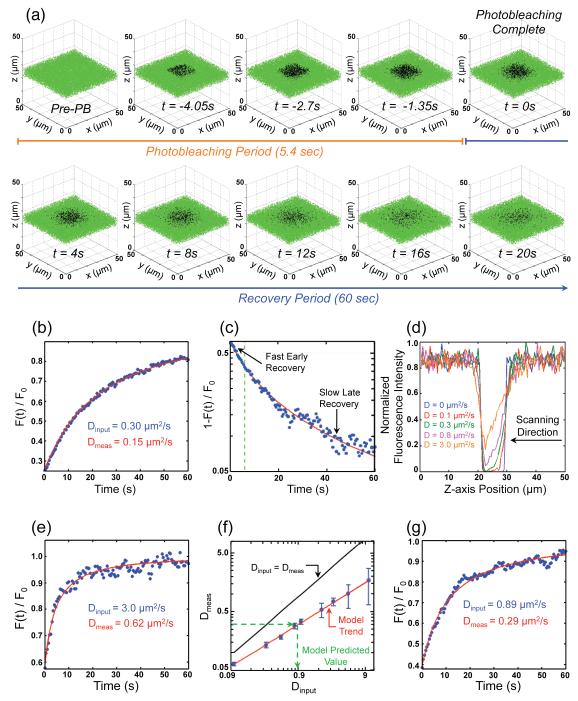
(a) Representative example of simulated fluorescence recovery for molecules with a diffusion coefficient of Dinput = 1.0 μm2/s. Green and black dots represent discrete fluorescent and photobleached molecules, respectively. Sequential images include progressive photobleach images (t<0) followed by images from 0-20 s post-bleach at 4 s intervals. Only a 7 μm wide slice from the 50 × 50 × 50 μm3 volume is shown so that the photobleached region in the center of the model volume may be more easily visualized. (b) Recovery curve for molecules with Dinput = 0.30 μm2/s. Data points are calculated at 0.5 s intervals and are represented by blue dots. Red line represents the solution to the 3D diffusion equation3 yielding the corresponding diffusion coefficient (Dmeas). (c) Log-linear plot of a typical recovery curve after instantaneous photobleaching (blue dots) and resulting fit from Brown et al.3 (red line) for molecules with Dinput = 1.0 μm2/s. Diffusive fluorescence recovery rate changes over time. Early recovery is rapid, followed by a relatively slow sustained recovery. Green dashed line marks the end of the experimental photobleaching period (~6 s)9. To quantitatively characterize the recovery rate as a function of time, it was assumed that F(t)/F0 = 1-e−kt, and therefore the rate (k) is given by the slope of the curve on a log-linear scale. (d) Fluorescence intensity cross-section along the optical imaging axis of the bleach zone at t = 0 sec (photobleaching complete) for a range of Dinput. Dinput = 0 μm2/s (shown in blue) represents instantaneous photobleaching. Each cross-section trace is normalized to the maximum fluorescence reading of all five traces. (e) Recovery curve, similar to that shown in (b), for molecules with Dinput = 3.0 μm2/s. (f) Log-log plot of Dmeas versus Dinput for a range of diffusion coefficients (blue dots ± SD). Red line represents a fit to the simulated data (blue dots), while black line represents the expected values (Dmeas = Dinput). The model predicted diffusion coefficient of D = 0.89 μm2/s was obtained through inverse prediction of the Dinput that resulted in Dmeas = 0.30 μm2/s, based on the model trend (red line). (g) Recovery curve, similar to that shown in (b) and (e), for molecules with Dinput = 0.89 μm2/s. Recovery curve has similar recovery timescale and measured diffusion coefficient (Dmeas) to that previously published9.

