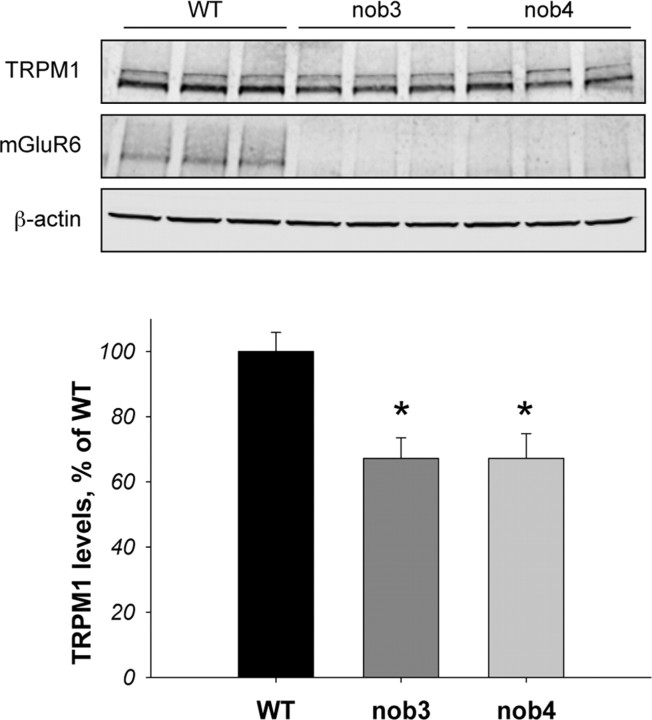
Figure 4.
Regulation of TRPM1 expression level by mGluR6. Western blot analysis of protein expression in wild-type (WT), nob3, and nob4 retinas. Total retina lysates (8.5 μg) obtained from three to four separate mice were loaded in each lane. Blots were probed with indicated antibodies, as described in Materials and Methods. β-actin detection was used as a loading control. Bottom, Quantification of the Western blotting data shown in the top panel. TRPM1 band intensities were determined by the Odyssey Infrared Imaging System and were normalized to β-actin content in the same sample. Values were reflected and plotted as the percentage of the level in WT retinas. Error bars represent SEM values. The asterisk indicates a statistically significant difference (p < 0.05), as revealed by Student's t test. The experiment shown is representative of four independent experiments yielding similar results.

