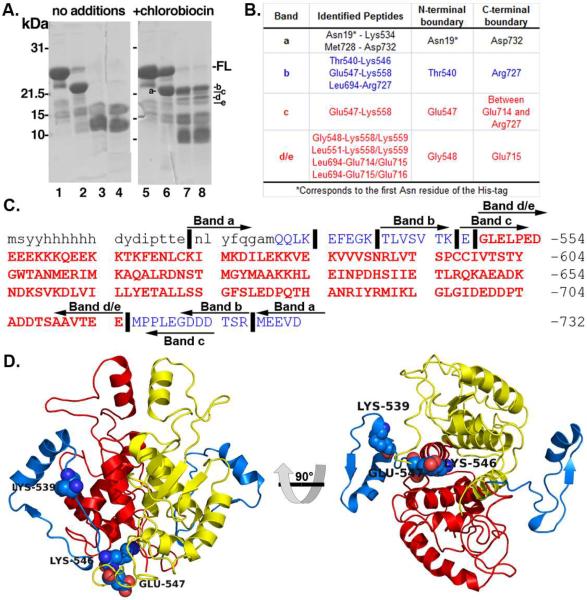
Figure 2.
V8 protease resistant core of Hsp90's C-terminal Domain. a) Protease-resistance of chlorobiocin bound Hsp90CT. Hsp90CT was incubated in the presence (lanes 2–4 & 6–8) of V8 protease with the addition of DMSO (vehicle control: lanes 1–4) or 800 mM chlorobiocin (lanes 5–8) for 0 min (lanes 2 & 6), 15 min (lanes 3 & 7) or 30 min (lanes 4 & 8). Lanes 1 and 5: Undigested full length Hsp90CT (-FL). Protease resistant bands a–e as indicated. b) Table including the sequences identified and boundaries for each band identified after proteolysis and SDS-PAGE. Red and blue rows correspond to the protease resistant core and flanking regions, respectively. c) Sequence of the Hsp90 C-terminus. Lower and upper case letters indicate residues from the His-tag and Hsp90 C-terminus, respectively. Vertical lines (∣) indicate important cleavage sites that define the boundaries of bands a–e. Peptide bands a–e are depicted by left and right arrows denoting N- and C- termini of these bands. Bold and red residues comprise the chlorobiocin induced Hsp90 CT protease resistant core. d) Hsp90 C-terminus, important cleavage sites labeled (spheres); red and yellow cartoons provide the protease resistant core from each Hsp90 monomer, while blue cartoon indicates upstream residues not part of protease resistant core.

