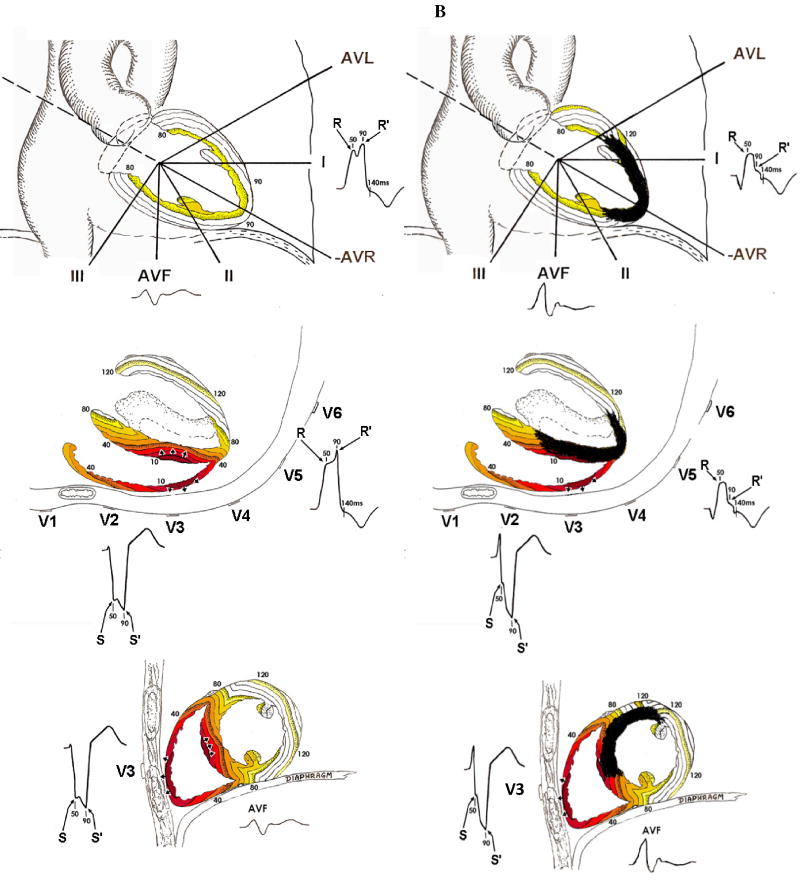
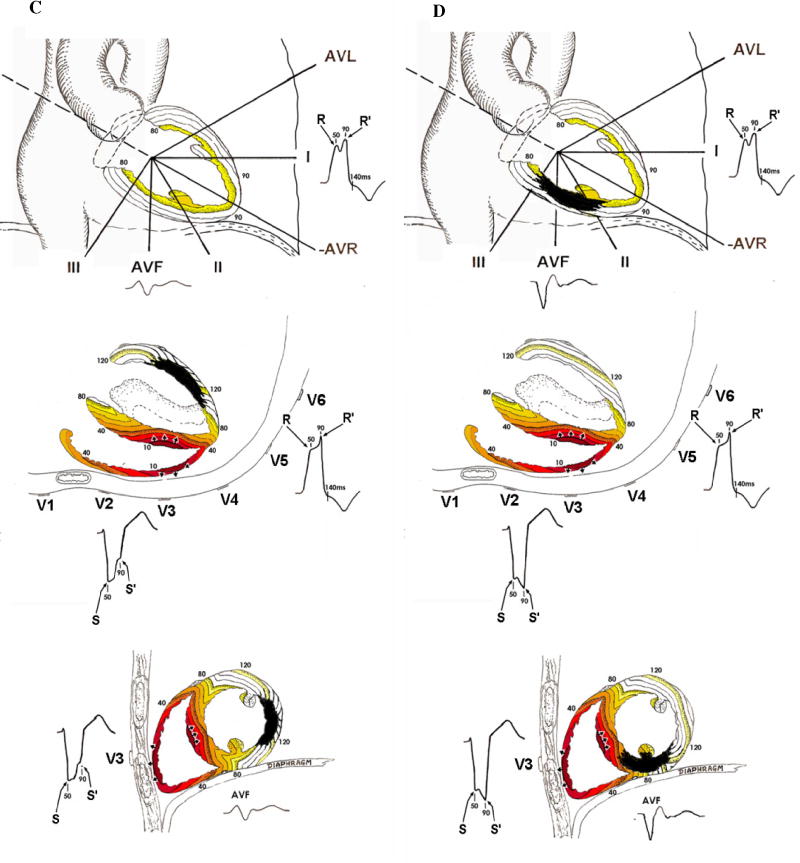
Figure 1. LBBB activation patterns.
All panels demonstrate the ventricular activation pattern in LBBB and ECG wave forms as seen from the frontal plane (top), horizontal plane (middle) and sagittal plane (bottom) in LBBB without infarction (A), LBBB with anteroseptal infarction (B), LBBB with posterolateral infarction (C) and LBBB with inferior infarction (D). Colored lines represent areas of myocardium activated within the same 10-millisecond period (isochrones). Numbers represent milliseconds since beginning of activation. Key ECG changes include the development of large R waves in V1–V2 with anteroseptal infarction (B), increased R/R’ amplitude ratios in V5–V6 with apical infarction (B), increased S/S’ amplitude ratios in V1–V2 with posterolateral infarction (C) and Q waves and decreased R/Q or R/S in aVF amplitude ratios with inferior infarction (D).


