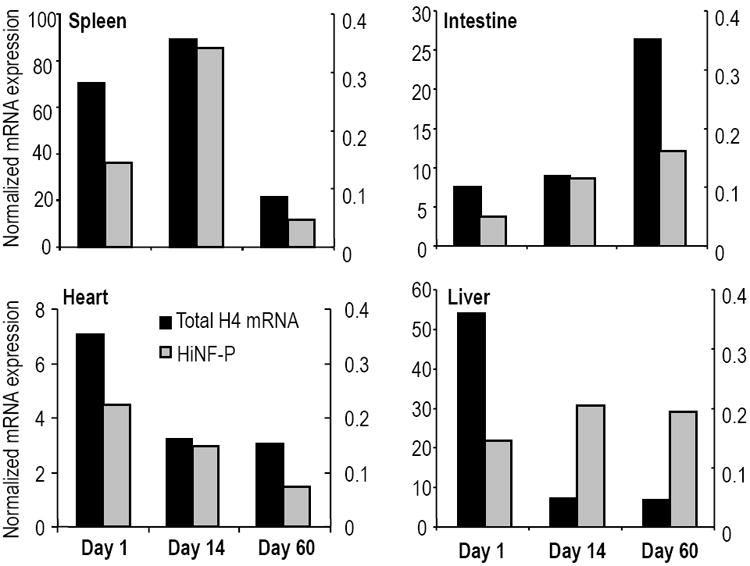
Figure 6. Temporal regulation of histone H4 and Hinfp gene expression during post-natal tissue development.

Total H4 mRNA levels (black columns) were obtained by the summation of normalized expression values for individual mouse histone H4 genes and were correlated with expression of the cognate regulatory factor Hinfp in selected tissues as indicated (i.e., spleen, intestine, heart and liver; see also Supplementary Figs. S2 and S3). The left y-axis shows total histone H4 mRNA levels and the secondary y-axis to the right indicates Hinfp gene expression. Experimental error is less than 10% (error bars not indicated).
