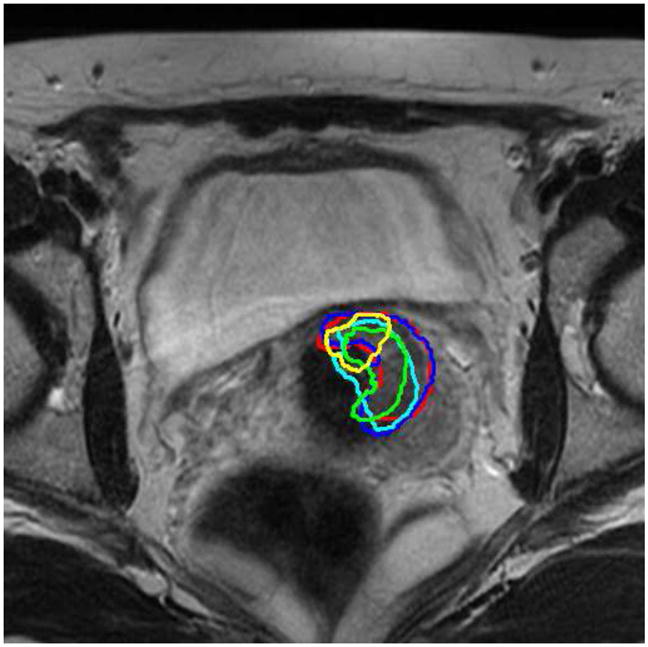
Figure 19.

Tumor/GTV contours from 5 treatment imaging days (shown in 5 colors on a representative slice) mapped to the planning-day MRI.

Tumor/GTV contours from 5 treatment imaging days (shown in 5 colors on a representative slice) mapped to the planning-day MRI.